1
Derivatives Rollover Report |September 25, 2020
For Private Circulation Only
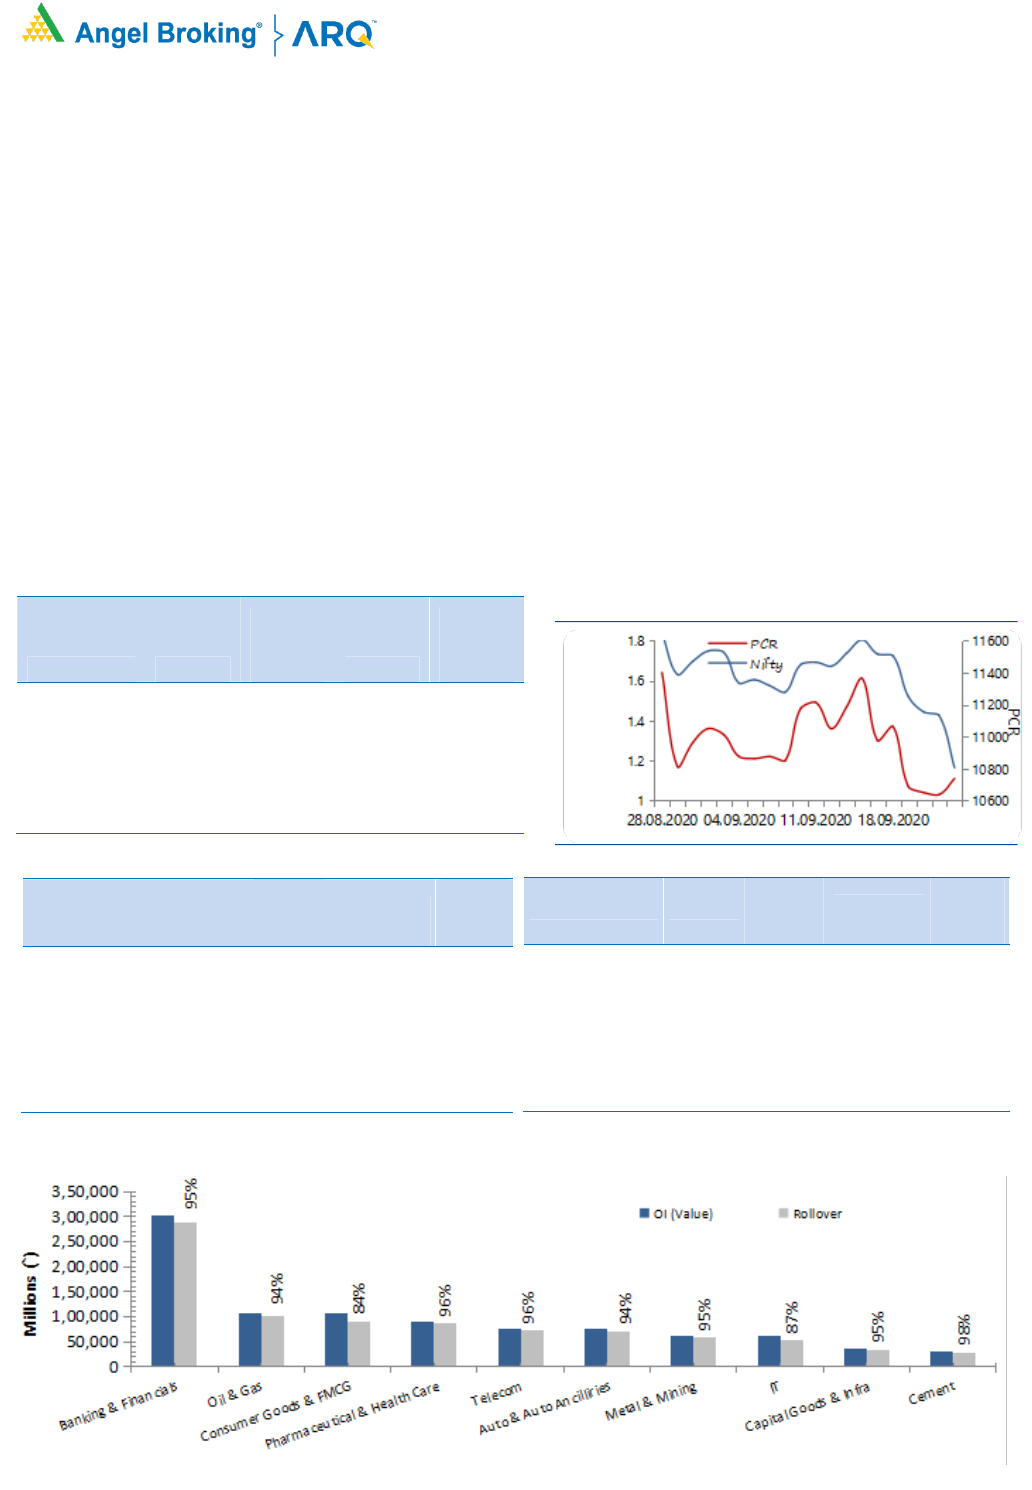
NIFTY & PCR Graph
Monthly Gainers
Scrip Price
Price
Change
(%)
Open
Interest
Ol
Change
(%)
APOLLOHOSP 1936.15
17.08
1211000
23.51
DRREDDY 5054.65
13.51
2466000
(19.95)
WIPRO 306.25
12.10
21139200
(11.81)
HCLTECH 791.45
11.17
13729800
13.15
COFORGE 2128.20
8.97
502500
64.62
Note: Stocks which have more than 1000 contract in Futures OI.
Monthly Losers
Scrip Price
Price
Change
(%)
Open
Interest
Ol
Change
(%)
IBULHSGFIN
139.90
(36.85)
9628600
(38.77)
BHEL
30.00
(24.15)
55104000
79.48
JINDALSTEL
164.85
(24.10)
22675000
7.46
CANBK
81.85
(23.22)
11330000
22.29
RBLBANK
157.70
(22.47)
18493800
(13.44)
Note: Stocks which have more than 1000 contract in Futures OI.
Nifty started the September series on an optimistic note around the 11600 mark. However, the markets failed
to carry the optimism for much longer and the correction in global
markets led to a decline in our markets too.
Post a corrective move upto 11185, Nifty pulled back higher towards 11600, but
it sold off sharply from there at
the end of the series and concluded at the lowest point at 10800, with a loss of about six and a half percent.
During the series, we saw long unwinding in Nifty, but the banking index witnessed short formation which led to
its underperformance and it registered a loss of over 13 percent. The rollover in Nifty is at 70.6 percent which is
lower than i
ts average of 76 percent, while rollover in Bank Nifty is at 79 percent versus its average of 77
percent. This indicates that shorts in the banking space have been rolled into the October series. FII'
s started
the September series with a good amount of lon
g positions, but as the series progressed they unwound their
longs and formed shorts too. Their ‘Long Short Ratio’ at the start of the new series is at 44 percent.
We could see some higher volatility at the start of the series. On pullback move, the inde
x could face resistance
in the range of 11100-
11200.Traders are advised to trade with a stock specific approach and watch out for
further developments.
Indices Change
INDEX Price
Price
Change
(%) Rollover
3
month
avg.
NIFTY
10805.55 (6.52)
70.63 76.05
BANKNIFTY
20456.85 (13.32)
79.05 77.42
-
- -
- -
-
- - - -
-
- - - -
Derivatives Rollover Report
For Private Circulation Only
2
Scrip Price
Price
Change
(%) OI Futures
OI
Change
(%) COC (%) PCR-OI
Rollover
(%)
Average
Rollover
(3month)
(%)
AUTO & AUTO ANCILLARIES
AMARAJABAT 709.40
(4.01)
826000
(18.06)
-1.98
0.24
84.72
88.15
APOLLOTYRE 116.20
(14.21)
8035000
(42.01)
2.25
0.53
78.97
89.33
ASHOKLEY 67.85
(7.56)
30996000
73.50
6.96
0.71
89.62
82.15
BAJAJ-AUTO 2946.85
(3.42)
1308250
(23.19)
5.34
0.78
96.82
95.60
BALKRISIND 1315.65
(4.99)
1288800
(8.73)
7.87
1.00
96.76
94.85
BHARATFORG 433.75
(15.45)
6414000
38.29
6.05
0.97
94.39
90.69
BOSCHLTD 12411.55
(12.56)
102050
(0.44)
1.76
0.000
99.17
97.84
EICHERMOT 2038.70
(9.20)
2110850
(19.08)
2.00
0.70
97.01
94.59
ESCORTS 1162.25
0.07
1948100
(24.25)
3.96
0.50
91.76
90.33
EXIDEIND 154.85
(11.31)
6818400
(28.69)
0.67
1.29
94.89
96.56
HEROMOTOCO 2928.25
(6.81)
1657800
(57.69)
3.56
0.80
95.08
89.32
M&M 577.65
(9.59)
14901600
4.37
4.72
0.43
94.90
94.20
MARUTI 6330.75
(11.15)
2255700
10.71
5.48
0.50
94.49
95.23
MOTHERSUMI 104.15
(11.44)
21819000
(11.22)
2.01
0.90
94.51
91.95
MRF 55969.10
(5.91)
39310
(20.34)
6.62
0.92
93.71
94.19
TATAMOTORS 123.45
(14.66)
71027700
(1.50)
5.52
0.60
95.13
93.75
TVSMOTOR 432.00
(4.56)
4278400
(22.16)
-7.67
0.45
85.29
88.77
BANKING & FINANCIALS
AXISBANK 404.15
(14.87)
53592000
11.02
4.41
0.72
96.70
94.54
BAJAJFINSV 5449.40
(16.78)
734000
2.18
4.55
1.04
91.81
92.06
BAJFINANCE 3039.95
(15.92)
4415000
(12.54)
3.80
0.71
93.20
94.04
BANKBARODA 40.05
(18.27)
43468200
(21.62)
5.23
0.89
90.66
93.79
CANBK 81.85
(23.22)
11330000
22.29
-18.15
0.74
87.93
88.67
CHOLAFIN 222.25
(6.72)
5720000
8.33
-34.26
0.31
95.25
87.28
FEDERALBNK 45.90
(18.40)
81651000
(12.79)
3.42
0.68
94.89
87.22
HDFC 1642.35
(12.16)
26550300
1.86
3.50
1.04
97.17
97.04
HDFCBANK 1031.10
(7.06)
38490100
4.83
0.71
0.68
97.22
95.26
IBULHSGFIN 139.90
(36.85)
9628600
(38.77)
8.26
0.41
73.86
83.07
ICICIBANK 337.60
(14.12)
117856750
(4.49)
5.90
0.80
97.32
96.22
ICICIPRULI 414.35
(8.16)
6894000
(13.36)
0.25
0.69
93.91
94.13
INDUSINDBK 492.45
(18.97)
30902400
(8.90)
4.68
0.68
96.11
97.01
KOTAKBANK 1248.60
(11.65)
11408400
2.94
2.09
0.97
92.84
94.86
L&TFH 56.55
(20.52)
23262800
(31.26)
5.56
1.04
84.51
90.30
LICHSGFIN 262.20
(11.87)
6756000
(27.18)
4.19
0.76
93.55
89.79
M&MFIN 114.05
(19.48)
14819532
(16.82)
5.52
0.74
89.57
83.16
MANAPPURAM 141.10
(9.17)
14154000
(23.26)
2.22
0.80
95.78
94.41
Derivatives Rollover Report
For Private Circulation Only
3
Scrip Price
Price
Change
(%) OI Futures
OI
Change
(%) COC (%) PCR-OI
Rollover
(%)
Average
Rollover
(3month)
(%)
MFSL 582.90
(3.80)
1402700
(28.97) 5.58
4.29
95.32
84.86
MUTHOOTFIN 1023.35
(14.54)
4110750
82.03
4.71
0.86
96.01
94.01
PFC 82.80
(15.34)
45055400
3.47
3.16
0.80
95.90
96.85
PNB 28.10
(21.07)
53830000
130.52
1.86
0.70
87.51
82.04
RBLBANK 157.70
(22.47)
18493800
(13.44) -0.66
0.87
91.22
92.64
RECLTD 95.65
(13.91)
16590000
(15.34) 3.83
1.17
92.41
94.92
SBIN 176.95
(18.36)
115551000
(2.16) 3.55
0.65
94.94
93.80
SRTRANSFIN 566.05
(21.90)
4524261
(3.38) 3.88
0.84
95.23
94.39
CAPITAL GOODS & INFRASTRUCTURE
ADANIPORTS 315.45
(10.50)
27960000
(0.44) 5.65
0.73
98.55
98.08
BHEL 30.00
(24.15)
55104000
79.48
5.24
0.75
91.75
86.82
GMRINFRA 21.25
(18.27)
76680000
17.60
4.93
0.82
87.65
85.19
HAVELLS 660.60
1.28
5738000
(0.71) -6.04
0.29
98.46
98.13
LT 853.55
(12.90)
12993750
24.11
3.49
0.73
93.78
94.66
SIEMENS 1205.20
(1.31)
1689050
(5.07) -5.34
0.82
98.12
96.77
VOLTAS 651.05
(1.04)
1752000
(8.75) 1.60
0.17
87.91
86.95
CEMENT
ACC 1307.30
(6.90)
1717500
(31.31) 2.92
0.38
94.60
96.12
AMBUJACEM 199.30
(10.31)
12630000
(6.01) 5.52
0.46
98.20
95.69
GRASIM 683.45
(0.47)
17505650
(4.46) 5.75
0.56
99.02
97.66
RAMCOCEM 696.45
(2.49)
947750
(17.16) 2.55
0.18
88.00
93.93
SHREECEM 18449.45
(14.72)
185400
58.60
6.11
0.38
96.09
95.18
ULTRACEMCO 3788.90
(6.80)
1684800
(19.85) 3.06
1.08
97.79
95.79
CHEMICAL & FERTILIZERS
PIDILITIND
CHEMICALS & FERTILIZERS
PIDILITIND 1404.75
(4.78)
2966500
(5.06)
3.91
1.04
98.38
97.43
TATACHEM 279.95
(15.41)
5154000
(20.95)
4.30
0.51
91.06
94.31
UPL
507.95
1.97
7173400
(27.01)
5.78
1.10
87.78
91.51
Consumer Goods & FMCG
ASIANPAINT 1926.15
(3.33)
2264400
(43.54)
4.24 0.50
85.82
93.24
BERGEPAINT 575.80
1.98
3286800
0.17
1.36 0.42
98.94
93.92
BRITANNIA 3631.30
(5.24)
917600
(1.21)
5.35 0.78
96.35
92.31
COLPAL 1376.15
(2.39)
2278500
(25.34)
1.67 0.88
98.58
98.24
CONCOR
556.00
(5
.86)
7139784
40.51
7.43
0.32
99.05
94.03
Derivatives Rollover Report
For Private Circulation Only
4
Scrip Price
Price
Change
(%) OI Futures
OI
Change
(%) COC (%) PCR-OI
Rollover
(%)
Average
Rollover
(3month)
(%)
DABUR 487.55
(1.40)
9663750
(11.72)
2.68
0.42
97.58
91.74
GODREJCP 693.50
1.66
4354000
9.01
3.02
0.09
91.59
84.45
HINDUNILVR 2057.45
(5.72)
6536700
(53.24)
-1.75
0.84
54.17
81.94
ITC 167.35
(14.27)
130816000
24.47
5.01
0.59
93.02
92.85
JUBLFOOD 2268.75
5.72
1954000
(24.59)
3.27
0.84
93.81
86.36
MARICO 343.60
(8.46)
9148000
(2.24)
3.04
0.53
98.73
96.30
MCDOWELL-N 496.85
(13.28)
15245000
(5.67)
2.74
0.62
95.81
96.15
NESTLEIND 15325.45
(5.35)
426800
0.67
4.55
1.02
97.19
92.55
TATACONSUM 489.95
(10.48)
16958700
63.95
2.77
0.67
93.93
92.15
TITAN 1101.15
(3.44)
5043000
(16.34)
4.76
0.49
94.07
93.15
UBL
924.65
(11.91)
1278200
13.35
4.70
0
.92
89.29
86.14
METALS & MINING
COALINDIA 116.35
(17.42)
43419500
40.24
5.86
0.92
92.02
89.99
HINDALCO 159.75
(17.80)
28586400
42.94
4.26
0.57
96.24
86.27
JINDALSTEL 164.85
(24.10)
22675000
7.46
4.13
0.50
93.97
94.90
JSWSTEEL 260.00
(10.30)
41941800
(15.15)
5.85
1.28
98.58
96.56
NATIONALUM 30.15
(19.17)
41361000
23.13
3.47
0.74
94.34
94.18
NMDC 76.30
(20.89)
37030900
12.13
6.19
0.78
88.59
93.73
SAIL 33.05
(19.88)
40660000
35.44
6.35
0.65
90.52
84.15
TATASTEEL 345.80
(19.41)
25889300
51.14
5.76
0.45
95.63
92.44
VEDL 132.30
3.04
107954400
49.19
4.35
1.71
96.40
86.08
Media
PVR 1057.35
(19.89)
1413918
19.05
-4.32
0.43
84.84
87.34
SUNTV 445.10
(8.08)
4405500
5.42
5.65
0.32
93.33
90.82
ZEEL 191.45
(8.96)
36837000
11.78
6.03
0.72
94.77
92.99
INFORMATION TECHNOLOGY
HCLTECH 791.45
11.17
13729800 13.15
4.17
0.34
93.51 90.52
INFY 970.95
2.04
29658000 (24.36)
-4.76
0.50
82.11 90.28
MINDTREE 1250.90
8.58
1449600 20.96
2.30
0.19
92.07 94.13
COFORGE 2128.20
8.97
502500 64.62
6.81
0.32
91.16 87.54
TCS 2332.90
3.34
6651000 (31.60)
0.29
0.96
73.84 89.23
TECHM 755.90
2.30
10076400 2.27
5.62
0.43
96.43 95.10
WIPRO 306.25
12.10
21139200 (11.81)
5.30
0.54
94.86 92.48
Derivatives Rollover Report
For Private Circulation Only
5
Scrip Price
Price
Change
(%) OI Futures
OI
Change
(%) COC (%) PCR-OI
Rollover
(%)
Average
Rollover
(3month)
(%)
INFORMATION TECHNOLOGY
HCLTECH 564.00
(0.70)
22885800
(1.26)
8.14
0.58
98.56
96.78
INFY 730.55
3.77
24351600
(52.50)
2.86
0.74
55.98
79.52
MINDTREE 782.95
10.93
1041600
(14.29)
-15.63
0.59
93.13
93.37
NIITTECH 1606.65
6.68
578250
26.08
-2.03
0.46
89.76
82.99
TCS 2212.80
6.19
15671500
(17.22)
6.42
1.91
95.02
94.74
TECHM 775.75
1.00
15406800
8.21
9.05
0.65
96.29
97.15
WIPRO 249.90
3.65
18211200
(29.64)
-2.08
0.72
83.12
92.60
MISCELLANIOUS
ADANIENT 272.00
(5.39)
15540000
13.96
5.98
0.56
96.62
95.67
APOLLOHOSP 1936.15
17.08
1211000
23.51
-6.18
0.28
89.47
87.81
BATAINDIA 1299.35
(4.28)
1497650
(5.19)
0.32
0.40
93.67
92.79
BEL 90.70
(17.36)
31768000
10.29
2.88
0.54
93.28
85.51
CONCOR 372.25
(5.77)
5597103
27.12
3.23
1.29
95.42
84.72
CUMMINSIND 436.55
(5.91)
1891200
19.21
-11.81
1.13
92.33
94.33
INDIGO 1193.70
0.31
3008000
25.31
-3.14
0.63
87.00
91.23
OIL & GAS
BPCL 378.90
(8.51)
23113800
25.06
4.56
1.04
95.22
93.62
GAIL 83.30
(16.24)
23259300
2.53
3.77
0.68
87.74
89.50
HINDPETRO 173.10
(17.20)
32616000
5.93
4.84
0.80
93.98
93.82
IGL 393.80
(3.17)
5083375
(36.32)
1.46
0.56
95.58
90.71
IOC 72.35
(17.41)
63116100
27.92
5.07
0.72
93.44
92.18
MGL 820.40
(15.58)
1302000
(2.47)
2.93
0.93
90.12
91.08
ONGC 66.75
(16.98)
52914400
10.29
1.56
0.65
91.65
87.21
PETRONET 211.70
(13.45)
11490000
5.51
4.95
0.82
95.97
94.24
RELIANCE 2191.50
3.51
31058510
(6.32)
4.92
0.64
94.39
95.33
PHARMACEUTICAL
AUROPHARMA 746.95
(15.23)
13981500
7.43
4.49
0.71
97.15
97.36
BIOCON 409.25
4.23
13482600
(15.33)
2.55
0.42
94.96
96.20
CADILAHC 376.95
(3.57)
6441600
(22.27)
1.80
0.44
94.63
96.18
CIPLA 737.75
(2.98)
13019500
(3.79)
6.11
0.46
96.54
94.29
DIVISLAB 3028.55
(7.56)
3543200
21.39
2.80
0.55
97.13
95.67
DRREDDY 5054.65
13.51
2466000
(19.95)
5.66
0.42
94.04
96.00
GLENMARK 455.10
(8.86)
6000700
(14.79)
1.72
0.56
94.49
91.40
LUPIN 984.15
(0.17)
7978100
2.39
4.84
0.57
96.81
92.95
PEL 1197.10
(21.78)
2988150
(10.05)
2.97
1.67
96.57
97.32
SUNPHARMA 487.95
(8.96)
31400600
(2.05)
4.62
0.67
98.29
97.80
TORNTPHARM 2658.40
(3.75)
837000
(44.44)
3.21
0.70
95.77
97.36
Derivatives Rollover Report
For Private Circulation Only
6
Scrip Price
Price
Change
(%) OI Futures
OI
Change
(%) COC (%) PCR-OI
Rollover
(%)
Average
Rollover
(3month)
(%)
POWER
NTPC 83.00
(19.53)
39854400
(1.05)
4.42
0.61
88.95
85.83
POWERGRID 160.30
(12.00)
15596000
78.36
6.22
0.93
88.86
77.98
TATAPOWER 50.75
(18.01)
71428500
(11.06)
6.20
0.54
96.99
96.87
TORNTPOWER 308.45
(10.88)
1785000
(20.24)
4.75
0.11
95.35
93.35
REAL ESTATE
DLF 146.75
(16.29)
27413100
22.18
3.57
0.73
96.92 84.69
TELECOM
BHARTIARTL 421.20
(17.85)
129582957
24.36
4.73
0.62
96.63
96.83
IDEA 9.15
3.39
289100000
(14.56)
5.73
0.41
84.98
72.29
INFRATEL 169.40
(15.34)
16441600
50.33
1.85
0.83
89.57
92.69
TEXTILES
PAGEIND 18919.65
(6.29)
114630
(12.00)
2.63
0.17
97.15
93.44
SRF 4023.30
(5.45)
524250
(7.05)
4.58
0.53
95.36
95.37

Derivatives Rollover Report
For Private Circulation Only
7
Technical and Derivatives Team:
Sameet Chavan Chief Analyst - Technical & Derivatives sameet.chavan@angelbroking.com
Ruchit Jain Senior Analyst - Technical & Derivatives ruchit.jain@angelbroking.com
Rajesh Bhosale Technical Analyst rajesh.bhosle@angelbroking.com
Sneha Seth Derivatives Analyst sneha.seth@angelbroking.com
Research Team Tel: 022 - 39357600 (EXTN - 6844) Website: www.angelbroking.com
For Technical & Derivative Queries E-mail: technicalresearch-cso@angelbroking.com
DISCLAIMER
Angel Broking Limited (hereinafter referred to as “Angel”) is a registered Member of National Stock Exchange of India Limited,
Bombay Stock Exchange Limited and Metropolitan Stock Exchange Limited. It is also registered as a Depository Participant with
CDSL and Portfolio Manager and Investment Adviser with SEBI. It also has registration with AMFI as a Mutual Fund Distributor.
Angel Broking Limited is a registered entity with SEBI for Research Analyst in terms of SEBI (Research Analyst) Regulations, 2014
vide registration number INH000000164. Angel or its associates has not been debarred/ suspended by SEBI or any other regulatory
authority for accessing /dealing in securities Market. Angel or its associates/analyst has not received any compensation / managed
or co-managed public offering of securities of the company covered by Analyst during the past twelve months.
This document is solely for the personal information of the recipient, and must not be singularly used as the basis of any
investment decision. Nothing in this document should be construed as investment or financial advice. Each recipient of this
document should make such investigations as they deem necessary to arrive at an independent evaluation of an investment in the
securities of the companies referred to in this document (including the merits and risks involved), and should consult their own
advisors to determine the merits and risks of such an investment.
Reports based on technical and derivative analysis center on studying charts of a stock's price movement, outstanding positions
and trading volume, as opposed to focusing on a company's fundamentals and, as such, may not match with a report on a
company's fundamentals. Investors are advised to refer the Fundamental and Technical Research Reports available on our website
to evaluate the contrary view, if any.
The information in this document has been printed on the basis of publicly available information, internal data and other reliable
sources believed to be true, but we do not represent that it is accurate or complete and it should not be relied on as such, as this
document is for general guidance only. Angel Broking Limited or any of its affiliates/ group companies shall not be in any way
responsible for any loss or damage that may arise to any person from any inadvertent error in the information contained in this
report. Angel Broking Limited has not independently verified all the information contained within this document. Accordingly, we
cannot testify, nor make any representation or warranty, express or implied, to the accuracy, contents or data contained within this
document. While Angel Broking Limited endeavors to update on a reasonable basis the information discussed in this material,
there may be regulatory, compliance, or other reasons that prevent us from doing so.
This document is being supplied to you solely for your information, and its contents, information or data may not be reproduced,
redistributed or passed on, directly or indirectly.
Neither Angel Broking Limited, nor its directors, employees or affiliates shall be liable for any loss or damage that may arise from or
in connection with the use of this information.
